Plot Nudged Elastic Band
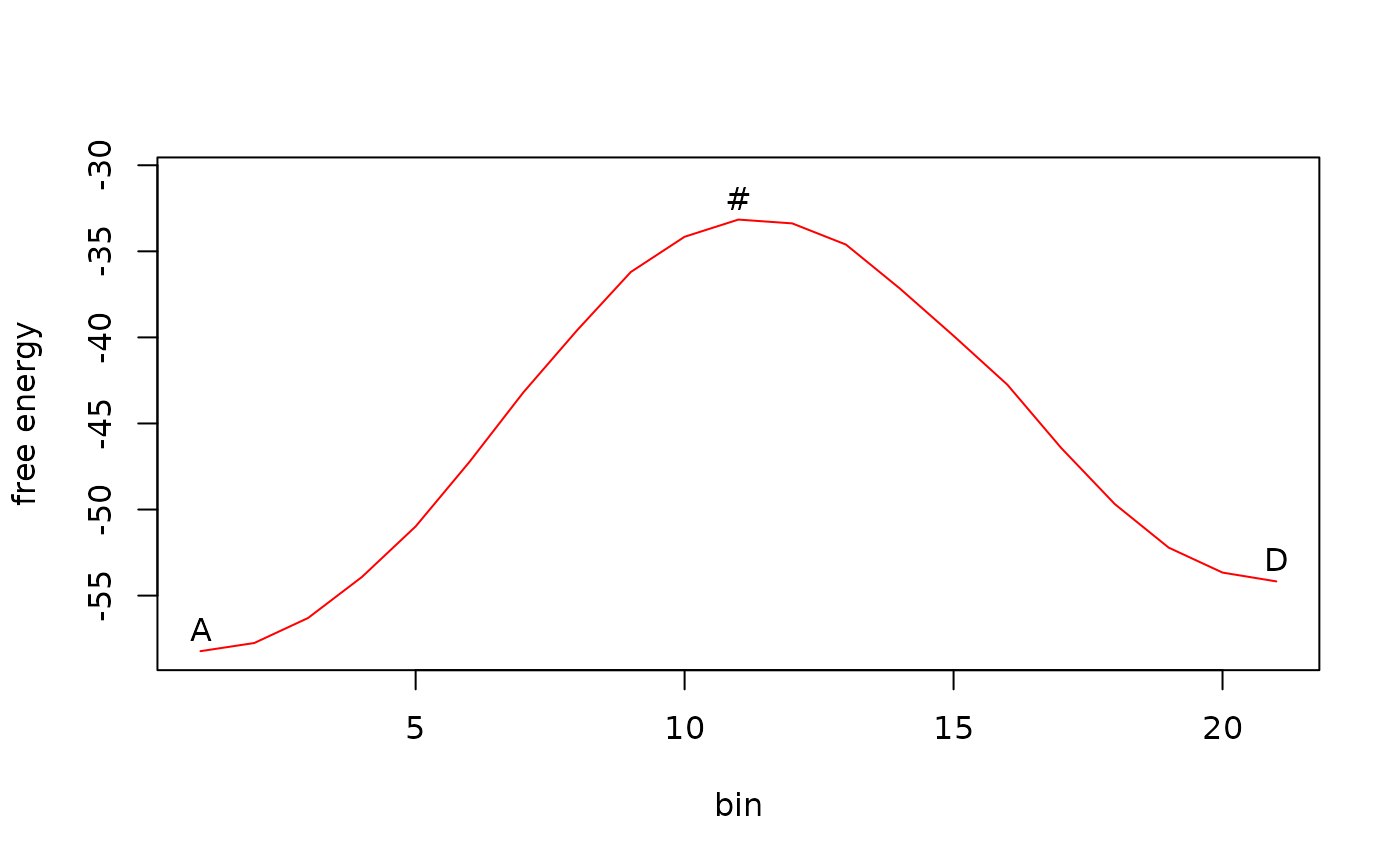
plot.nebpath.Rd`plot.nebpath` plots free energy profile calculated by Nudged Elastic Band.
# S3 method for nebpath
plot(x, xlim = NULL, ylim = NULL, main = NULL,
  sub = NULL, xlab = "bin", ylab = "free energy", col = "red",
  lwd = 1, asp = NULL, cex = 1, axes = T, ...)
Arguments
- x
nebpath object.
- xlim
numeric vector of length 2, giving the x coordinates range.
- ylim
numeric vector of length 2, giving the y coordinates range.
- main
an overall title for the plot: see 'title'.
- sub
a sub title for the plot: see 'title'.
- xlab
a title for the x axis: see 'title'.
- ylab
a title for the y axis: see 'title'.
- col
color code or name, see 'par'.
- lwd
line width for drawing symbols see 'par'.
- asp
the y/x aspect ratio, see 'plot.window'.
- cex
text expansion.
- axes
a logical value indicating whether both axes should be drawn on the plot.
- ...
further arguments passed to or from other methods.
