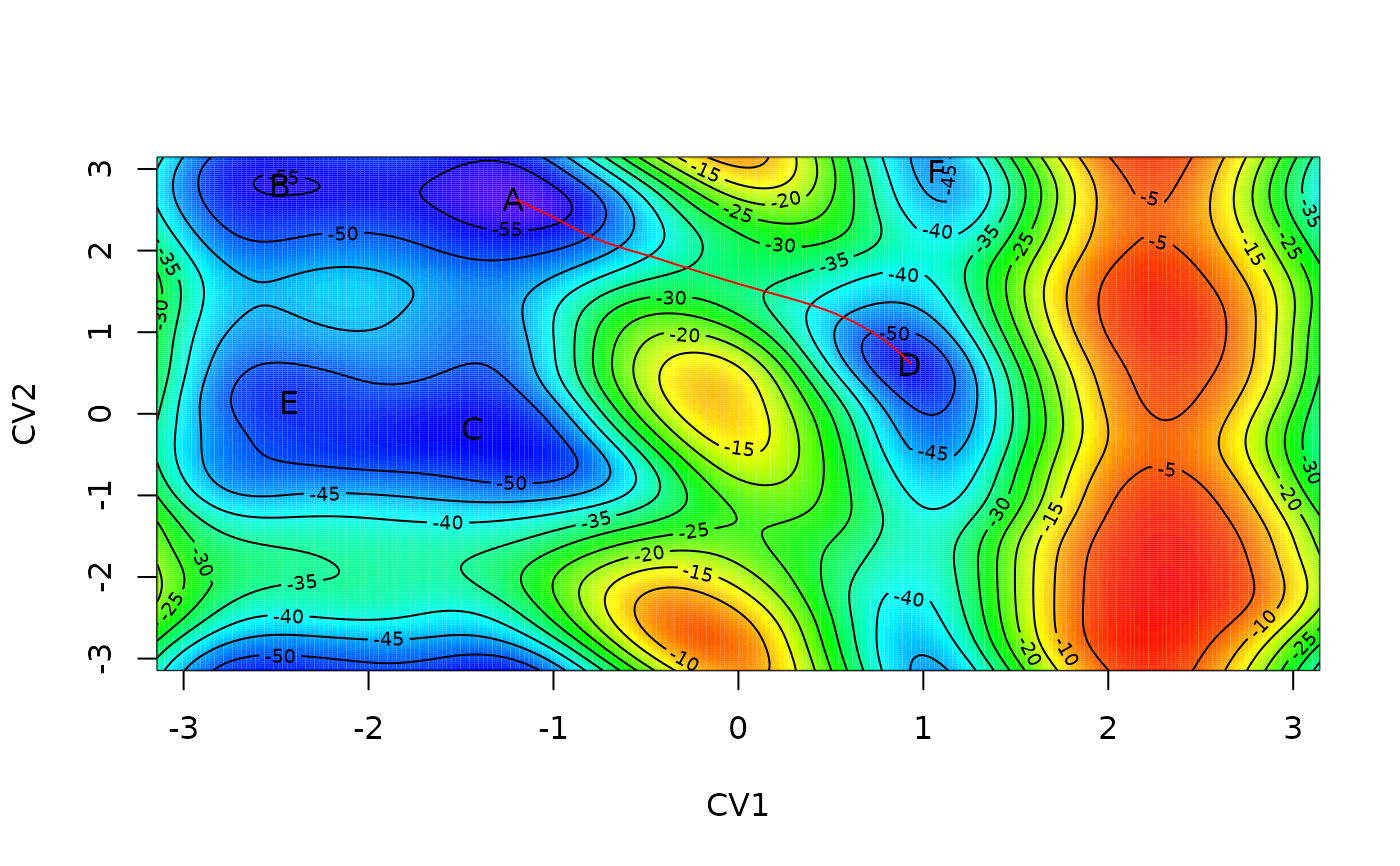
Plot lines for Nudged Elastic Band projected onto free energy surface
linesonfes.Rd`linesonfes` plots lines for free energy profile calculated by Nudged Elastic Band projected onto free energy surface.
linesonfes(x, col = "red", lwd = 1)Arguments
- x
nebpath object.
- col
color code or name, see 'par'.
- lwd
line width for drawing symbols see 'par'.